Seizing the moment: Enabling schools to manage COVID-19 using data-driven analysis


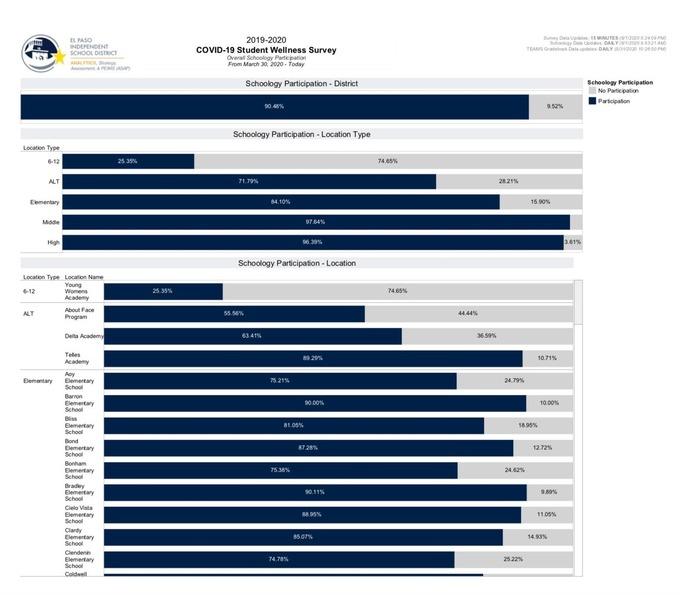
For most school districts, the first step in providing an alternate system of instruction was to assess what students wanted and needed in order to participate. They distributed surveys to households, both on paper and over the phone and web, to find out each student's readiness for online remote learning. Did they have a laptop or other connected device for attending classes? Did they need a Wi-fi hotspot in order to access the internet? Once online, could they successfully connect to the district's learning systems? In addition to technological readiness, surveys were also useful for tracking students' engagement. "We wanted to know how students were feeling about distance learning," said Hope Langston, director of assessment services for the Northfield Public School District in Minnesota. Survey responses indicated the level of difficulty students have adjusting to the changes, helping identify areas that needed the most urgent attention. Northfield continues to offer follow-up surveys that help measure their progress in addressing these issues over time. Equal Opportunity Schools (EOS), a Seattle-based nonprofit dedicated to improving access for students of color and low-income students, has conducted research throughout the pandemic that assesses remote learning by aggregating various factors of student sentiment, including teacher and principal evaluation, barriers to motivation, and "belonging" as it pertains to their identity, culture, and classroom experience. EOS uses Tableau to relate these factors to one another and gain insights into possible paths for achieving a more comprehensive learning experience for all students. But school isn't entirely about teaching and learning. Districts have resources that help make sure students are healthy and safe, and deploying those resources during COVID-19 also requires a data-driven strategy. The El Paso Independent School District input survey data into Tableau visualizations and used them for planning nutritional and medical interventions where they were needed, including conducting telehealth sessions between school nurses and students who fell ill. If a household couldn't be reached for survey or classroom participation, truancy officers investigated to check on the wellbeing of students in their homes. As a district whose majority population is economically disadvantaged, and where one-third of students has limited English proficiency, these interventions were especially important for ensuring effective, equitable outreach. Similarly, Northfield used Tableau to visualize survey responses and other data related to their holistic pandemic response, with a heightened focus on achieving equity for underserved areas of the district's community, one-quarter of whom qualify for free and reduced lunch. Using a need-based "heat map" visualization as a daily tracker, Northfield set up food distribution centers in strategic locations and tracked the number of meals delivered per day at each site. Langston and her team also used the data to mobilize local volunteers to help families with language and socioeconomic challenges navigate connectivity. Throughout these efforts, the availability and visibility of survey responses and other data has been key to coordinating an effective response. "Our dashboards help us meet a need in our community, by getting us the information we need as clearly and as quickly as possible," said Langston. "We couldn't have done this if we didn't have an accurate picture of what the need is."
Read the full article at: www.tableau.com
Stay up to date
Subscribe to the free Label News newsletter and receive the latest content every week. We'll never share your email address.


